
Cockpit
The Cockpit is the first page you see after logging in. It shows you at a glance how your devices and gateways are doing — without switching between separate lists.
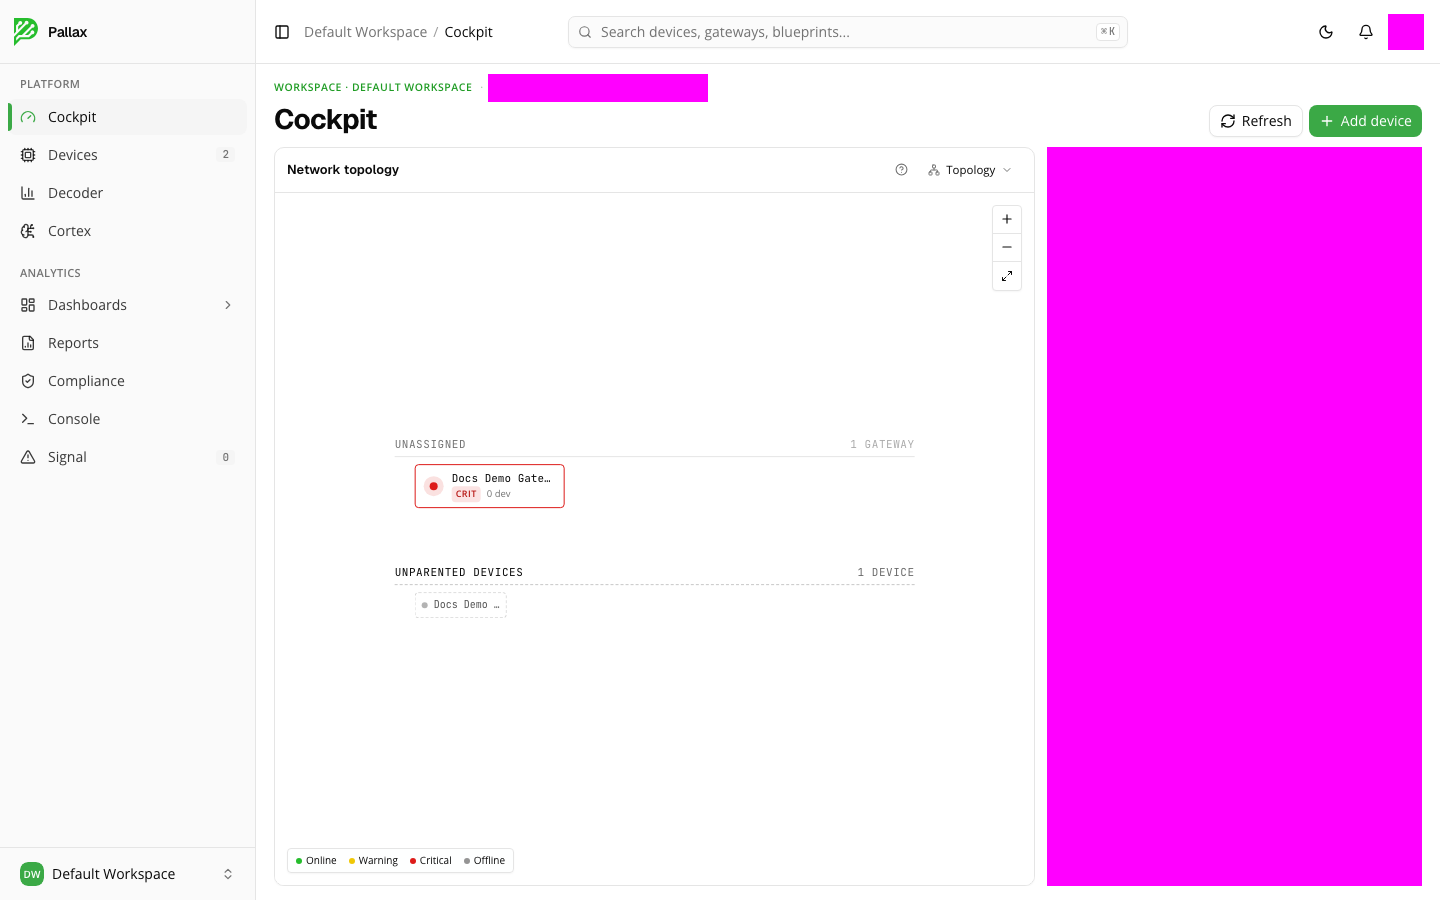
Seeing your fleet's state at a glance
The Cockpit is divided into several tiles:
- Network topology shows your gateways and devices as a graph. A colored dot marks each element's state: online, warning, critical, or offline. You can zoom in and out and restrict the view to gateways, devices, or both.
- Device status counts how many of your devices are currently online, and lists below it any that currently need attention.
- Fleet health shows the ratio of healthy to unhealthy devices and the alert events of the last 24 hours.
- Activity is a live feed of recent events. If nothing is happening right now, you'll see an empty list rather than an error.
The timestamp in the top left ("Last sync … ago") shows how old the displayed data already is. Clicking it refreshes immediately — just like the Refresh button.
Continuing from here
- Add device starts the wizard for a new device or gateway directly from the Cockpit (see the Devices chapter for details).
- Clicking Open Signal in the Activity tile takes you to the full alert list in the Signal chapter.
- Clicking an element in the topology or in the "Needs attention" list opens that element's detail page with all its values.