
Console
The Console bundles the logs of several systems — MQTT broker, network server, gateway bridge, Mioty Service Center, Application Center, agent, and audit — into a single, searchable history.
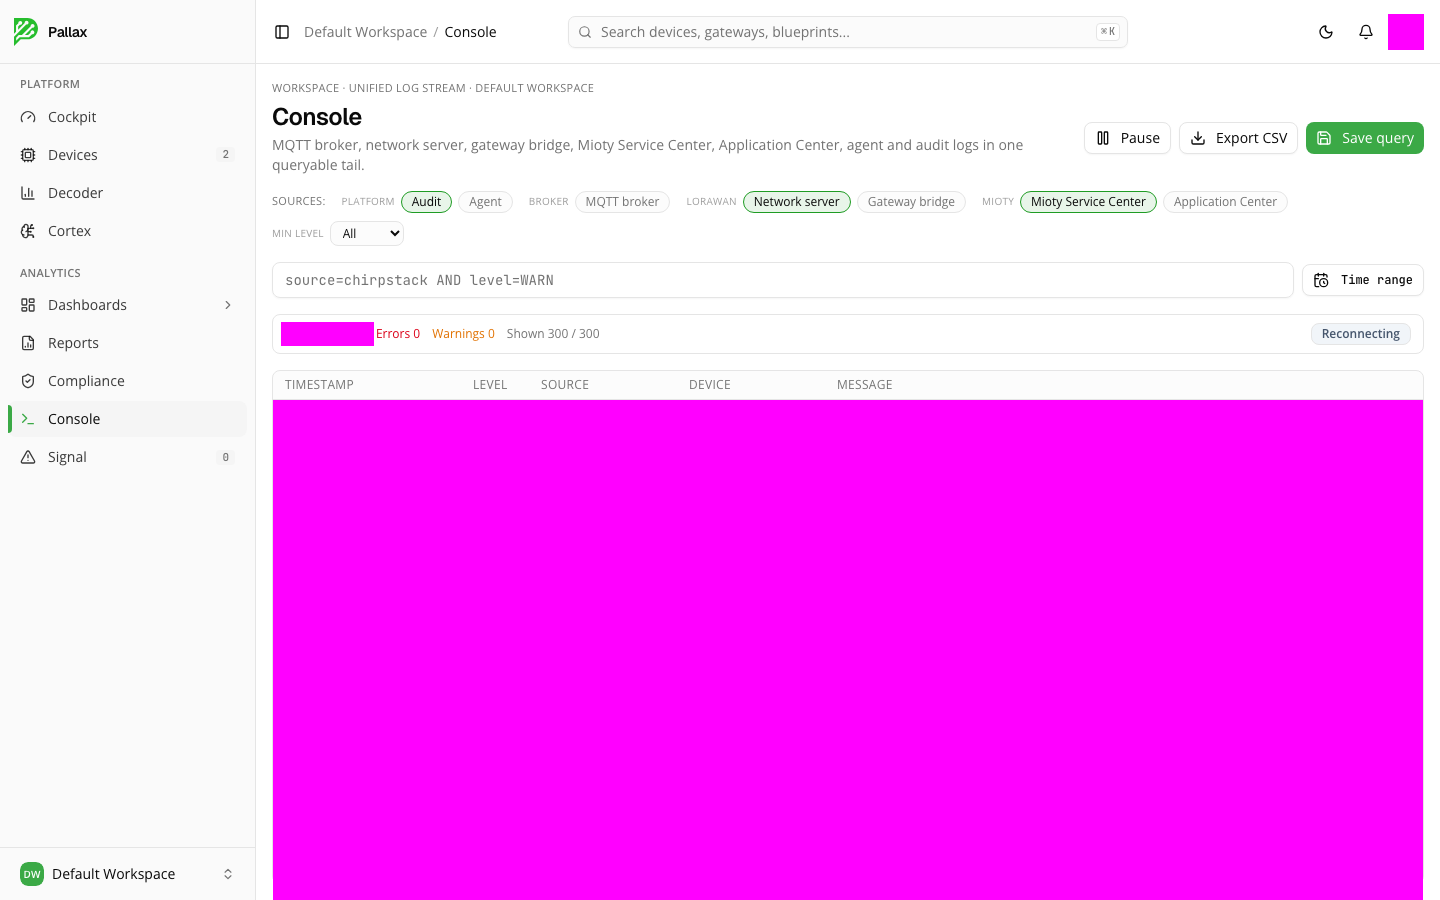
The magenta block in the screenshot deliberately replaces the actual log area: a stream of new lines runs there in real time, changing on every visit, so it can't be shown as a fixed image. In the Console itself you'd see a table there with timestamp, severity, source, affected device, and the message itself.
Narrowing down the logs
The source filters let you show or hide individual systems, grouped by area (Platform, Broker, LoRaWAN, Mioty). The severity filter restricts the display to Debug, Info, Warning, or Error, and the time range picker lets you choose the time window. Above the table you can see, continuously, the events per minute as well as the number of errors and warnings in the current window.
Working with the stream
Pause stops the live stream so you can read a particular line at your own pace. Export CSV takes the currently visible excerpt with you, and Save query remembers a filter combination for your next visit.