
Dashboards
With Dashboards you put together your own charts from your devices' data — for the overview no prebuilt report can give you.
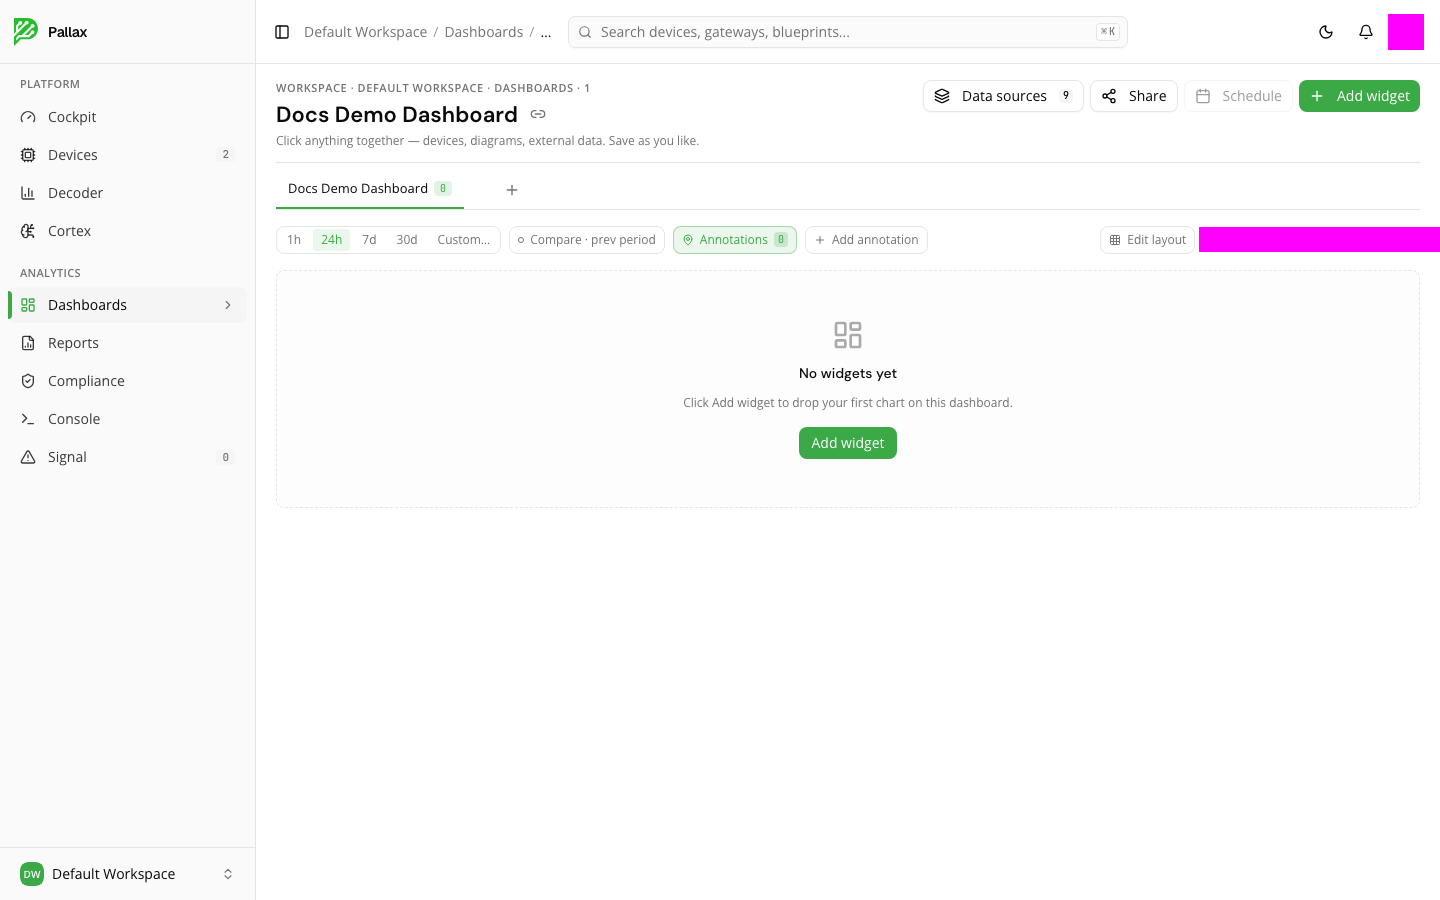
Creating and setting up a dashboard
The plus tab next to your existing dashboards creates a new one; each dashboard gets its own tab. Add widget places your first chart — a new dashboard starts out empty and shows that plainly, rather than simulating a misleading example view. Edit layout lets you rearrange existing widgets.
Data sources shows how many sources are available for widgets. Share hands a dashboard off to someone else, and Schedule sets up a recurring delivery.
Adjusting the time range and annotations
At the top of the toolbar you choose the displayed time range (1 hour, 24 hours, 7 days, 30 days, or custom) and can compare it against the previous period. Add annotation marks a specific point in time on the chart, for example an event that explains the values.
Below the toolbar you can see who owns the dashboard, how many people are currently viewing it, and when it was last edited.